 (CSi) North Dakota exported $5.32 billion in 2017, a slight increase of 0.2% over 2016. Excluding oil, North Dakota’s exports increased by 5.63% in 2017 over 2016, paralleling the 6.59% increase in overall U.S. exports. North Dakota fell two spots in its ranking among US states in 2017, going from 36th among the states in 2016 to 38th in 2017, with Oklahoma and West Virginia pulling ahead of North Dakota in 2017.
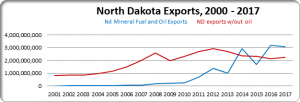
In 2017, crude oil exports comprised 58% of ND’s total exports, but most of this oil is simply going through a pipeline that crosses briefly into Canada and isn’t actually sold into Canada. Shifts in oil and non-oil exports can be viewed in the graph. Several of North Dakota’s top exported machinery products saw increases in 2017, including self-propelled dozers, tractors, combines, and farm implements. Ethanol was another leading ND export, with over $115 million in 2017, a 6% increase over 2016. Food commodities that saw decreases include wheat (1.2% decrease), corn (22% decrease), lentils (4% decrease) and dry beans (1% decrease), whereas soybean exports were up 120% and malting barley was up 6%. There was a 4.6% increase in the number of unique items exported from North Dakota, from 1,338 items in 2016 to 1,400 in 2017.
Canada continues to be North Dakota’s number one export destination, taking in $4.4 billion, or 83% of North Dakota’s total exports (including oil in the pipeline). Mexico is the second largest market for North Dakota products, importing $244 million (4.58% of ND’s total exports). Exports into Mexico decreased by 4.91%, caused primarily by a decrease in wheat exports. China jumped into the 4th place (behind Australia) for North Dakota’s top export markets with a large increase in soybean exports (over $28 million in ND soybeans exported to China in 2017, up from less than $100,000 in 2016). Other countries in the top 10 saw modest increases or decreases with the exceptions of Japan, Ukraine, and Nigeria growing by 15%, 70%, and 270% respectively.
For information on the U.S. Commercial Service, call the U.S. Commercial Service – North Dakota office at (701) 239-5080, or visit http://export.gov/northdakota/.


Comments are closed
Sorry, but you cannot leave a comment for this post.